4-Point 3D Doughnut Chart Infographic
This template features a visually engaging 3D doughnut chart divided into four segments, ideal for showcasing proportional data or key components.
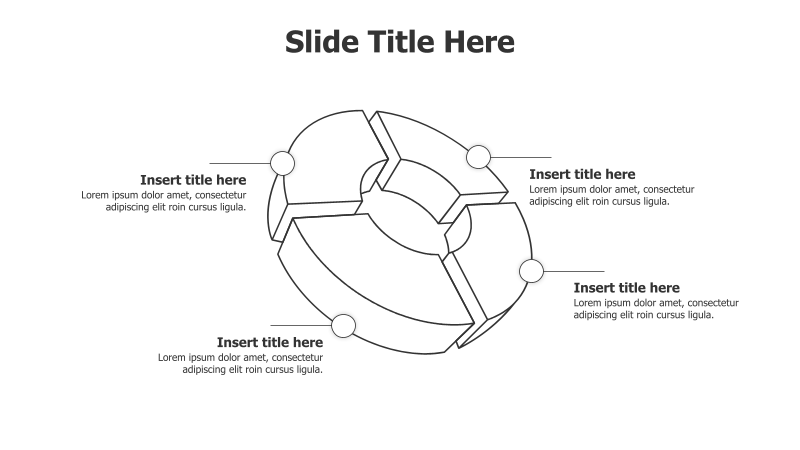
Layout & Structure: The template utilizes a 3D doughnut chart as its central element, divided into four distinct sections. Each section is connected to a text placeholder via a circular connector. The arrangement is circular, emphasizing interconnectedness and completeness.
Style: The design incorporates a subtle 3D effect with soft shadows, creating depth and visual appeal. The color palette is neutral, promoting a professional and modern aesthetic. The overall style is clean and minimalist, focusing on clarity and impact.
Use Cases:
- Presenting market share distribution.
- Illustrating the components of a whole (e.g., budget allocation).
- Showcasing the stages of a process.
- Highlighting key performance indicators (KPIs).
- Representing the different aspects of a project.
Key Features:
- Fully customizable colors and text.
- Clear visual representation of proportions.
- Engaging 3D effect for enhanced impact.
- Easy-to-understand layout.
- Suitable for a variety of business and educational presentations.
Tags:
Ready to Get Started?
Impress your audience and streamline your workflow with GraphiSlides!
Install Free Add-onNo credit card required for free plan.