4-Point Editable Vertical Meters Infographic
This template features a clean and modern design for visualizing progress, levels, or stages.
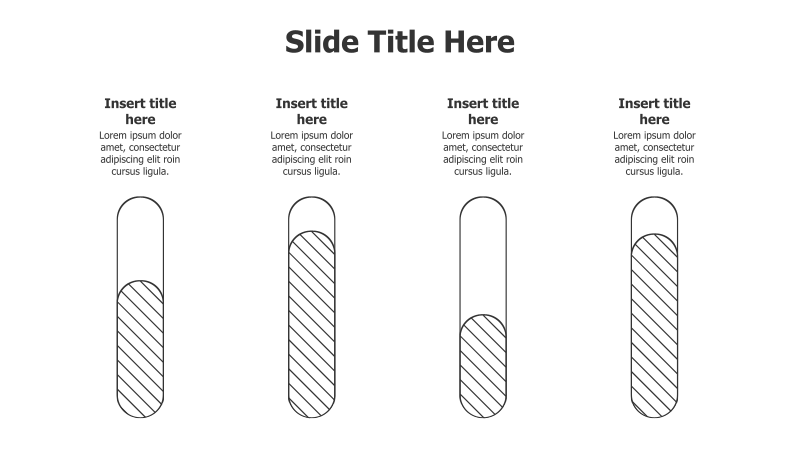
Layout & Structure: The slide presents four vertically oriented, capsule-shaped meters. Each meter is divided into sections with diagonal stripes, indicating a fill level. The meters are arranged in a horizontal row, providing a clear side-by-side comparison. Each meter has a title and description area above it.
Style: The template utilizes a minimalist aesthetic with a light gray background and simple shapes. The diagonal stripes within the meters create a subtle visual texture. The overall style is professional and easy to understand.
Use Cases:
- Tracking project progress against milestones.
- Illustrating different levels of achievement or performance.
- Representing stages in a process or workflow.
- Comparing key metrics across different categories.
- Visualizing the completion of tasks or goals.
Key Features:
- Fully editable shapes and text.
- Clear visual representation of progress.
- Simple and professional design.
- Easy to customize with your own data and branding.
Tags:
Ready to Get Started?
Impress your audience and streamline your workflow with GraphiSlides!
Install Free Add-onNo credit card required for free plan.