6-Point Editable Doodle Meter Infographic
This template features a circular diagram with six editable sections, ideal for showcasing progress, key elements, or stages in a process.
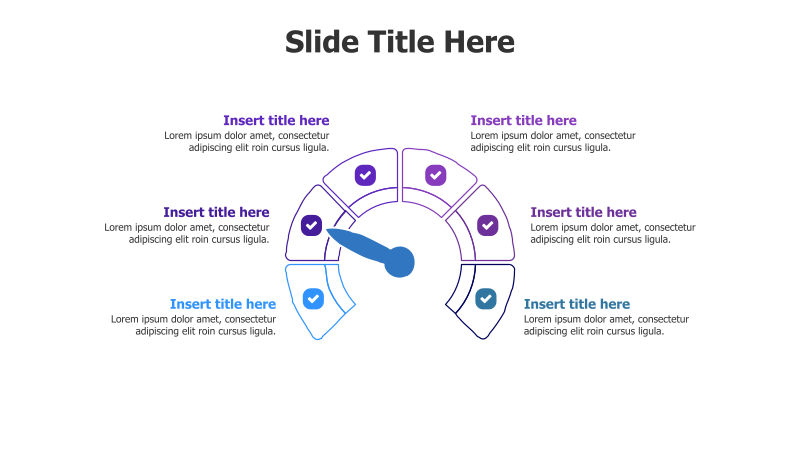
Layout & Structure: The template utilizes a circular "meter" design divided into six equal segments. Each segment contains a title placeholder and a brief description area. A central arrow indicates a level of completion or focus. The segments are arranged around a central point, creating a radial flow.
Style: The design incorporates a doodle-like aesthetic with rounded shapes and a flat color palette. Subtle shadows add depth, and checkmark icons provide a visual cue for completion or confirmation. The overall style is modern and approachable.
Use Cases:
- Presenting project milestones and progress.
- Illustrating key performance indicators (KPIs).
- Highlighting the stages of a process.
- Showcasing the components of a system.
- Visualizing a survey or assessment with six categories.
- Representing six core values or principles.
Key Features:
- Fully editable text and icons.
- Clear visual representation of six distinct points.
- Engaging and modern doodle-style design.
- Easy to understand and interpret.
- Suitable for a wide range of business and educational presentations.
Tags:
Ready to Get Started?
Impress your audience and streamline your workflow with GraphiSlides!
Install Free Add-onNo credit card required for free plan.