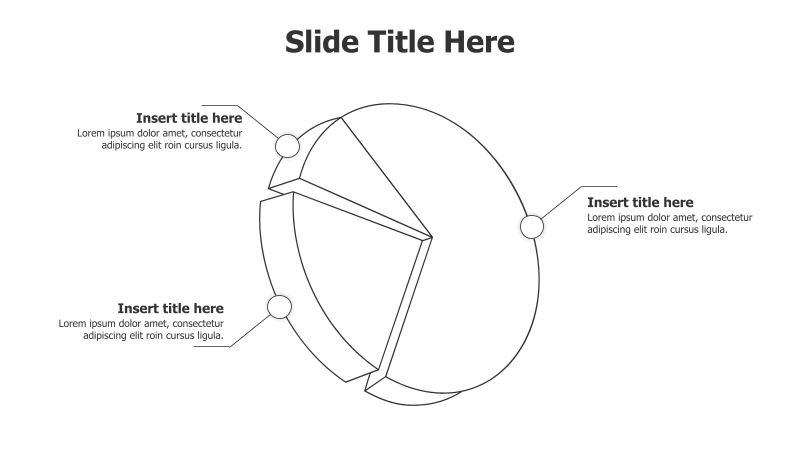
3-Point 3D Pie Chart Infographic
This template features a 3D pie chart divided into three segments, ideal for showcasing proportional relationships or key components.
Layout & Structure: The template utilizes a circular pie chart divided into three distinct sections. Each section is represented as a 3D wedge, creating a visually dynamic effect. Text boxes are positioned adjacent to each segment for labeling and detailed explanations. The overall structure is designed to highlight the relative contribution of each component to the whole.
Style: The design employs a clean, minimalist aesthetic with a light color palette. The 3D effect adds depth and visual interest, while the thin outlines maintain a professional look. The template is designed to be easily customizable with different colors and fonts.
Use Cases:
- Presenting market share distribution.
- Illustrating the breakdown of a project budget.
- Showing the composition of a team or department.
- Highlighting key performance indicators (KPIs).
- Demonstrating the allocation of resources.
Key Features:
- Fully editable shapes and text.
- Visually appealing 3D effect.
- Clear and concise presentation of data.
- Suitable for a wide range of business and educational applications.
- Easy to understand proportional relationships.
Tags:
Ready to Get Started?
Impress your audience and streamline your workflow with GraphiSlides!
Install Free Add-onNo credit card required for free plan.