4-Level User Satisfaction Meters
This template presents four individual gauges to visually represent user satisfaction levels.
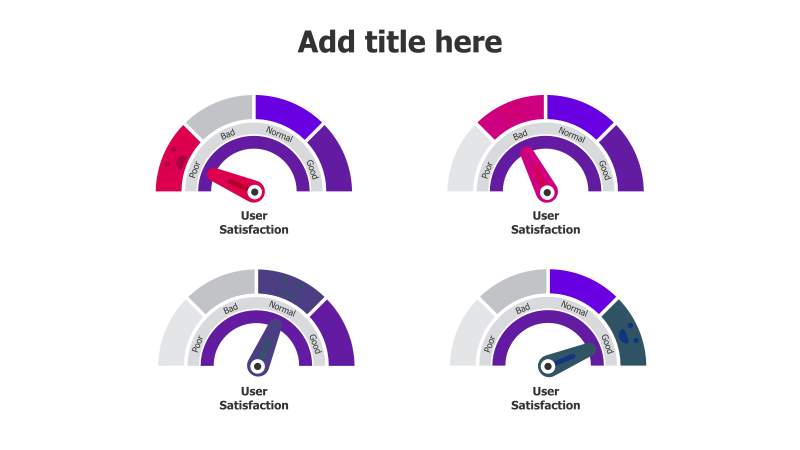
Layout & Structure: The slide features four semi-circular gauges arranged in a 2x2 grid. Each gauge is divided into four sections representing 'Poor', 'Bad', 'Normal', and 'Good' satisfaction levels. A needle indicates the current satisfaction level within each gauge.
Style: The template employs a clean and modern aesthetic with a pastel color palette. Each gauge has a distinct color (red, purple, gray, and teal). The use of a gauge metaphor provides a clear and intuitive visual representation of satisfaction levels.
Use Cases:
- Presenting user feedback from surveys.
- Tracking customer satisfaction over time.
- Comparing satisfaction levels across different products or services.
- Illustrating the impact of improvements on user experience.
Key Features:
- Visually appealing gauge design.
- Clear and concise representation of satisfaction levels.
- Easy to understand and interpret.
- Customizable colors and labels.
Tags:
gaugemeteruser satisfactionfeedbackcustomer experiencesurveylevels4 levelsvisualpastelmodern
Ready to Get Started?
Impress your audience and streamline your workflow with GraphiSlides!
Install Free Add-onNo credit card required for free plan.