Fishbone Diagram Template
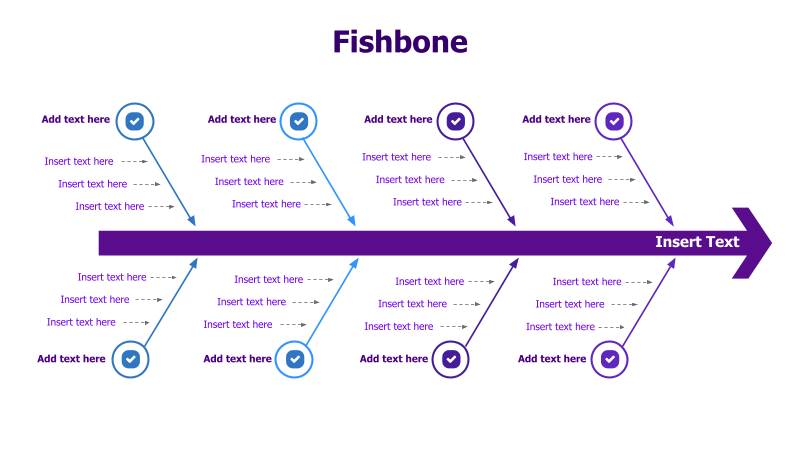
This template provides a visually engaging Fishbone diagram, also known as an Ishikawa diagram or cause-and-effect diagram, for root cause analysis.
Layout & Structure: The template features a central spine with angled branches extending from it. It includes eight main branches, each representing a major category of potential causes. Each main branch has multiple sub-branches for detailed analysis. The structure facilitates a systematic exploration of contributing factors to a specific problem.
Style: The diagram utilizes a clean, modern aesthetic with a light blue color scheme. The use of circular nodes and arrow connectors enhances clarity and visual appeal. The overall design is professional and easy to understand.
Use Cases:
- Root cause analysis of problems or issues.
- Identifying potential causes of defects in manufacturing.
- Analyzing factors contributing to project delays.
- Brainstorming solutions to complex challenges.
- Improving processes and quality control.
Key Features:
- Fully editable text boxes for customization.
- Clear visual hierarchy for easy understanding.
- Professional and modern design.
- Suitable for a wide range of analytical applications.
Tags:
Ready to Get Started?
Impress your audience and streamline your workflow with GraphiSlides!
Install Free Add-onNo credit card required for free plan.