4-Point Editable Stripes with Percentage Infographic
This template features a clean and modern design for presenting information in a structured, progressive manner.
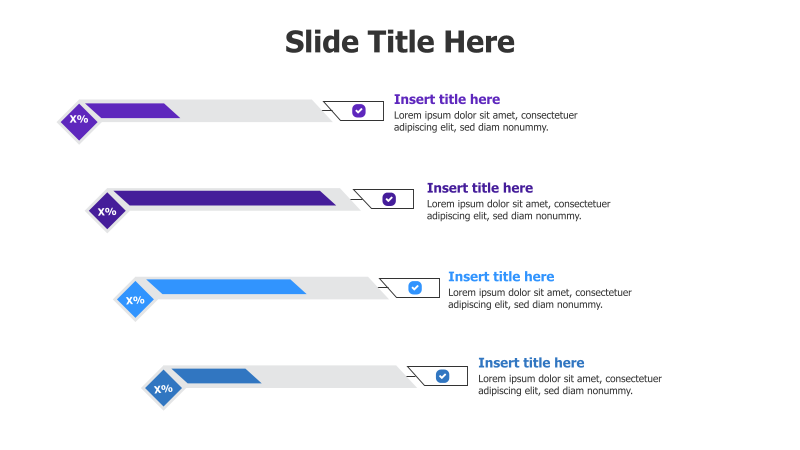
Layout & Structure: The slide consists of four horizontal stripes, each representing a distinct point or stage. Each stripe includes a percentage indicator and a connecting arrow leading to a text box. The arrangement creates a clear left-to-right flow, ideal for showcasing sequential processes or comparative data.
Style: The template utilizes a flat design with subtle gradients and shadows to create a sense of depth. The color scheme is a combination of blues and oranges, providing a visually appealing and professional aesthetic. The use of icons and clear typography enhances readability.
Use Cases:
- Presenting project milestones and progress.
- Illustrating key performance indicators (KPIs).
- Comparing different options or strategies.
- Showcasing a step-by-step process.
- Highlighting the stages of a product lifecycle.
Key Features:
- Fully editable shapes and text.
- Clear visual hierarchy for easy understanding.
- Modern and professional design.
- Percentage indicators for quantitative data.
- Versatile for various business and educational presentations.
Tags:
Ready to Get Started?
Impress your audience and streamline your workflow with GraphiSlides!
Install Free Add-onNo credit card required for free plan.