4-Level Doodle Meter Infographic
This template presents information using a series of doodle-style meters, each representing a different level of completion or progress.
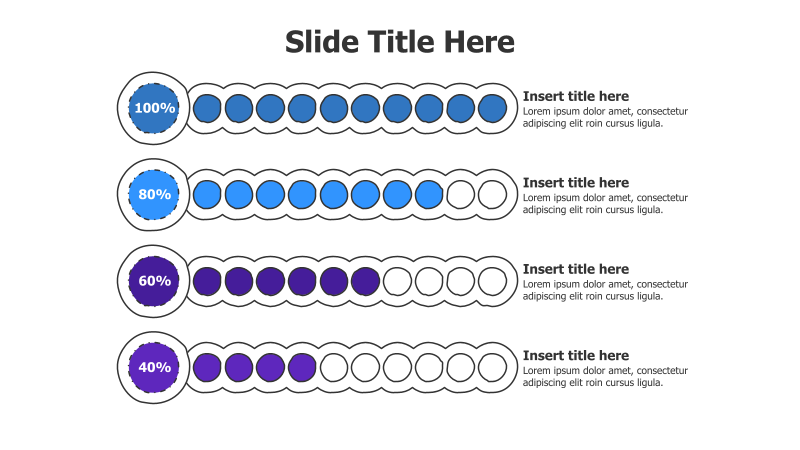
Layout & Structure: The slide features four horizontal rows, each containing a series of ten circular "doodle" elements. Each row represents a different level (100%, 80%, 60%, and 40%), with the filled circles indicating the percentage completed. A text box is positioned to the right of each meter for detailed explanations.
Style: The template employs a playful, doodle-like aesthetic with rounded shapes and a light color palette. The use of different colors for each level adds visual distinction. The overall style is modern and approachable.
Use Cases:
- Presenting project progress updates.
- Illustrating levels of expertise or skill.
- Showing completion rates for different tasks.
- Visualizing customer satisfaction scores.
- Demonstrating the stages of a process.
Key Features:
- Visually engaging doodle style.
- Clear representation of percentages.
- Fully customizable colors and text.
- Easy-to-understand progress indicators.
- Suitable for a wide range of topics.
Tags:
Ready to Get Started?
Impress your audience and streamline your workflow with GraphiSlides!
Install Free Add-onNo credit card required for free plan.