4-Level Round User Satisfaction Gauge
This template presents a circular gauge to visually represent user satisfaction levels.
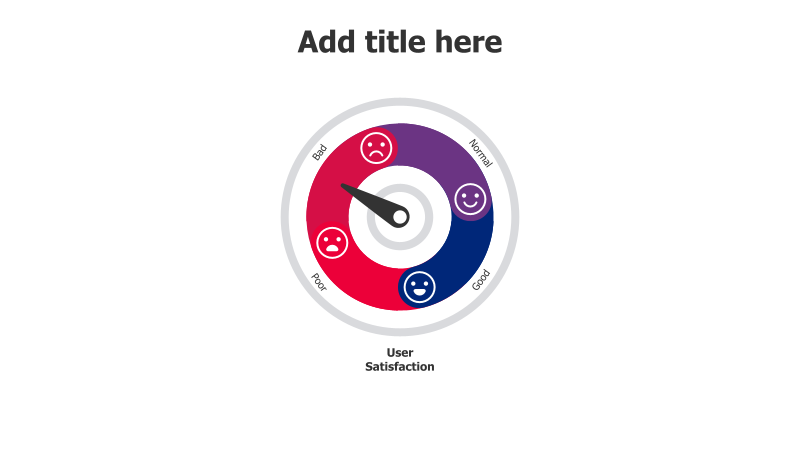
Layout & Structure: The template features a circular gauge divided into four quadrants representing different satisfaction levels: Bad, Normal, Poor, and Good. A pointer indicates the current satisfaction level. The gauge is centered on a white background with a clear label at the bottom.
Style: The design employs a clean and modern aesthetic with a color-coded scheme (red for negative, blue for positive). Simple smiley face icons represent each level. The use of a gauge provides a clear and intuitive visual representation of the data.
Use Cases:
- Presenting user feedback from surveys.
- Illustrating customer satisfaction metrics.
- Tracking product or service performance.
- Reporting on user experience (UX) research.
- Visualizing sentiment analysis results.
Key Features:
- Clear and concise visual representation.
- Easy-to-understand satisfaction levels.
- Visually appealing color scheme.
- Fully customizable pointer and labels.
Tags:
Ready to Get Started?
Impress your audience and streamline your workflow with GraphiSlides!
Install Free Add-onNo credit card required for free plan.