6-Level Risk Assessment Charts
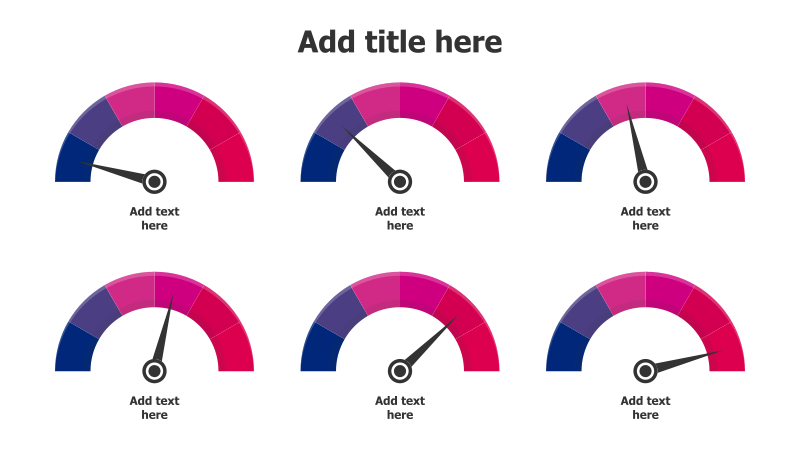
This template features six semi-circular charts arranged in a 2x3 grid, visually representing levels of risk or progress.
Layout & Structure:
- The template consists of six identical semi-circular gauges.
- Each gauge is divided into two colored sections: a dark blue outer arc and a pink inner arc.
- A needle points to a specific level within each gauge, indicating a value or status.
- Text placeholders are provided below each gauge for adding descriptions or labels.
- The arrangement is a simple grid, allowing for easy comparison between the six levels.
Style:
- The template utilizes a clean and modern aesthetic.
- The color scheme is vibrant and eye-catching, with a contrast between the blue and pink.
- The gauges have a flat design with subtle shadowing to create a sense of depth.
- The overall style is professional and suitable for business presentations.
Use Cases:
- Risk assessment and mitigation planning.
- Performance evaluation across different departments.
- Progress tracking for project milestones.
- Severity levels of issues or problems.
- Customer satisfaction ratings.
- Representing different stages of a process.
Key Features:
- Fully customizable colors and labels.
- Clear visual representation of levels.
- Easy to understand and interpret.
- Suitable for a wide range of data and concepts.
Tags:
risk assessmentchartsgaugeslevelsprogressperformancepinkbluediagrambusinessmetricsindicatorsassessment
Ready to Get Started?
Impress your audience and streamline your workflow with GraphiSlides!
Install Free Add-onNo credit card required for free plan.